Debug Environment
- Thomas Watteyne
- Mathivanan Elangovan
- Thomas Watteyne
This step will guide you through the debug setup we are using and we believe is the most helpful when implementing IEEE802.15.4e.
Debug Environment
You will need:
- At least two motes.
- Available GPIOs on each mote which you can set/clear in your code to debug timing issues.
- A scope or logic analyzer to visualize the GPIOs during execution.
- (recommended) A toolchain with JTAG/Trace to allow you to place a breakpoint in your code during execution and inspect memory.
- (optional) A scope to visualize the current draw of your mote, to see whether the radio is on.
We are using:
- GINA motes.
- IAR Embedded Workbench for TI MSP430.
- A Tektronix MSO2024 oscilloscope with 4 analog channels and 16 digital channels. We use the analog channels to crreutn draw of the mote, and the digital channels to visualize/debug the IEEE802.15.4e state machine.
- A NCI GoLogic logic analyzer. This is redundant with the scope above.
Debug pins
IEEE802.15.4e is a TDMA protocol; time is cut into slots and motes send and receive at very precise times within each slot. To be able to "see" your slots, we recommend you identify 6 unused GPIOs on your mote. You can then set/clear/toggle them at different instants in your code to verifiy timing. You will use the following GPIOs for debug:
name | description | importance |
frame | toggles at every frame boundary | medium |
slot | toggles at every slot boundary | high |
fsm | set/cleared at beginning of tx/rx slot; toggles every time FSM changes state | high |
task | high iff the CPU is on in task mode | low |
isr | high iff the CPU is on in interrupt mode | low |
radio | high iff the radio is on | medum |
If you don't have enough pins on your mote, or enough channels on your scope, use the "importance" columns to pick as subset.
Prepare your code
Once you've picked the 6 debug pins, we recommend you use #define statements to initialize (set as output), set, clear and toggle each of these pins. An example is shown below.
#define DEBUG_PIN_FRAME           0x20           // P4.5
#define DEBUG_PIN_FRAME_INIT      P4DIR |=  DEBUG_PIN_FRAME
#define DEBUG_PIN_FRAME_TOGGLE    P4OUT ^=  DEBUG_PIN_FRAME
#define DEBUG_PIN_FRAME_CLR       P4OUT &= ~DEBUG_PIN_FRAME
#define DEBUG_PIN_FRAME_SET       P4OUT |=  DEBUG_PIN_FRAME
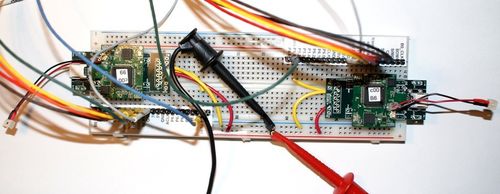
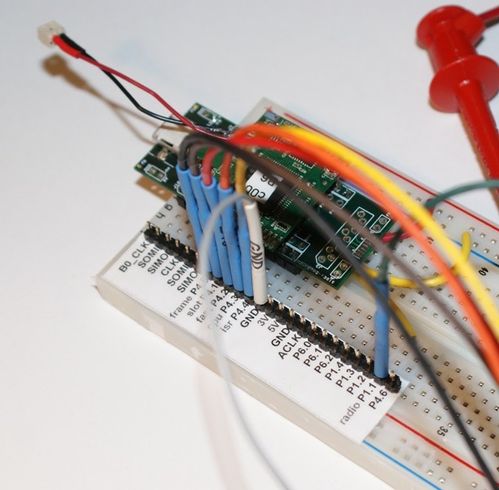
Breadboard
Since you will have many pins to monitor, we recommend you mount motes onto a breadboard:
- most of the time, you will only need two motes, so mounting two motes on the breadboard is enough;
- we recommend you print and stick a label on the pins. Doing this now avoids losing time figuring out which pin does what. Feel free to use and modify our stencil, which is sized for headers with a 0.1 inch pitch (Microsoft Visio needed).
- optionally, you can add a 1-Ohm resistor in series with the power supply of the board. Looking at the voltage drop across that resistor with a scope allows you to see the current draw.
Scope setup
Most scopes allow you to save the setup to a file. We recommend you take some time to display the state of the pins, assign a label to each channel and save that configuration in your scope.
- If you're using a Tektronix MSO2024, feel free to use
our scope setup. - If you're using a NCI GoLogic, feel free to use
our project file.
Once you've configured your scope, you'll be able to follow the execution of the code, as shown below.
On the scope:
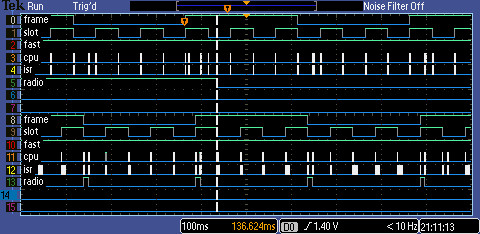
On the GoLogic:

GoLogic
NCI's GoLogic is a great USB logic analyzer which connects with the GoLogic2 software.
Even if you don't have the hardware|we recommend you install GoLogic2 (which is free) since we provide GoLogic traces throughout this website.
See TschTraces for a list of traces.
sniffer
There are many IEEE802.15.4 sniffers on the market, and any will do. We happen to be using Texas Instruments' CC2531-EMK:
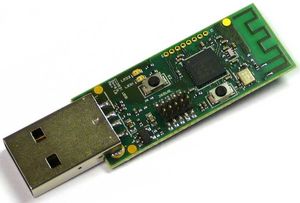
You can use TI's (free) packet sniffer software with it. This software allows you to save the sniffed packets. It also allows you to files with previous sniffed traces.
This is the setup we use to connect the sniffer traces listed in Debug Environment.
Wireshark sniffer
Atmel based free wireshark sniffer tool.
ATxMEGA256A + AT86RF233 ZigBit USB Stick (ATZB-X-233-USB)
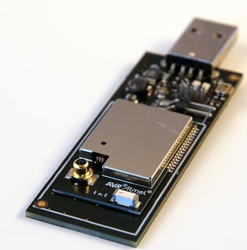
Link to download the sniffer interface tool: Atmel Gallery Link
Firmware for the sniffer comes along with sniffer interface tool.
Related content
