...
| Gliffy | ||||||||||||
|---|---|---|---|---|---|---|---|---|---|---|---|---|
|
| Gliffy | ||||||||||||
|---|---|---|---|---|---|---|---|---|---|---|---|---|
|
| Gliffy | ||||||||||||
|---|---|---|---|---|---|---|---|---|---|---|---|---|
|
OpenVisualizer is the OpenWSN visualization/debugging tool. It's a set of python scripts designed to aid in the debugging process, or simply serve as a visualization platform. OpenVisualizer supports the following features:
...
primary tool for plugging your OpenWSN network into the Internet.
| Table of Contents |
|---|
Features
- Connects your OpenWSN network to the Internet over a virtual interface (both Windows and Linux).
- portable across popular operating systems.
- Shows the internal state (neighbor table, scheduling table, queue, etc.) of each node physically connected to the interface;
- displays the multi-hop graph;
- translate error codes into human-readable sentences;
- buttons allows a use to trigger the sending of a packet;
- *New! * nodes can be connected either locally or remotely as an OpenVisualizer probe.
Running it
- install Python from http://www.python.org/;
- install PySerial from http://pyserial.sourceforge.net/;
- download the OpenVisualizer directory. See important note below;
- double click on openVisualizerGui.py.
Important: OpenVisualizer is sensitive to its directory structure. OpenVisualizer displays any potential errors that a mote may throw over serial or IP. It does this efficiently by scanning the openwsn.h file for error codes. The best way to make sure that this setup works, is by simply checking out the entire OpenWSN project from the SVN. Otherwise, please make sure that the following holds:
OpenVisualizer should be placed in: (your openwsn-sw directory)/software/openvisualizer/bin/openVisualizerGui/
openwsn.h should be located in: (your openwsn-fw directory)/firmware/openos/openwsn/
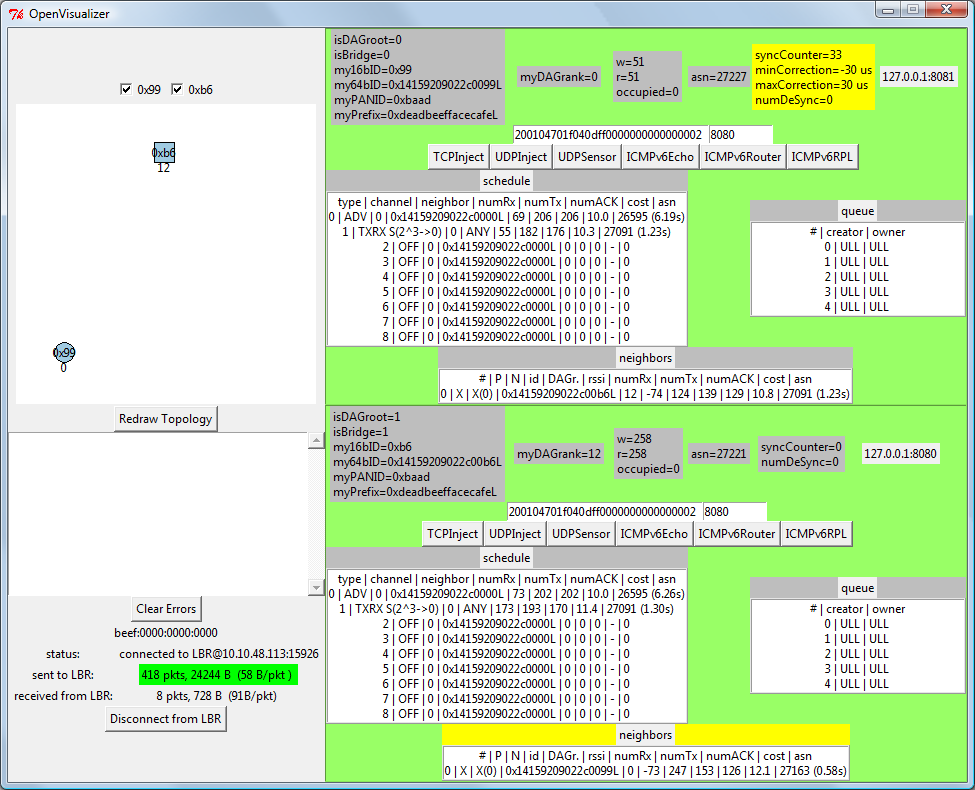
The OpenVisualizer Window is depicted on the right. By default, the right pannel is closed. The numbers under the graph at the 16-bit short identifiers of the nodes connected via USB to the application. Click on any checkbutton will open the corresponding frame in the right panel. Each of these frames shows the internals of the nodes, including a few button to force it to send an ICMPv6 echo, a UDP or a TCP packet. In each table, the line which was just updated is displayed with a yellow background. The lower-left part of the window contains the errors reported by the nodes.
Code Organization
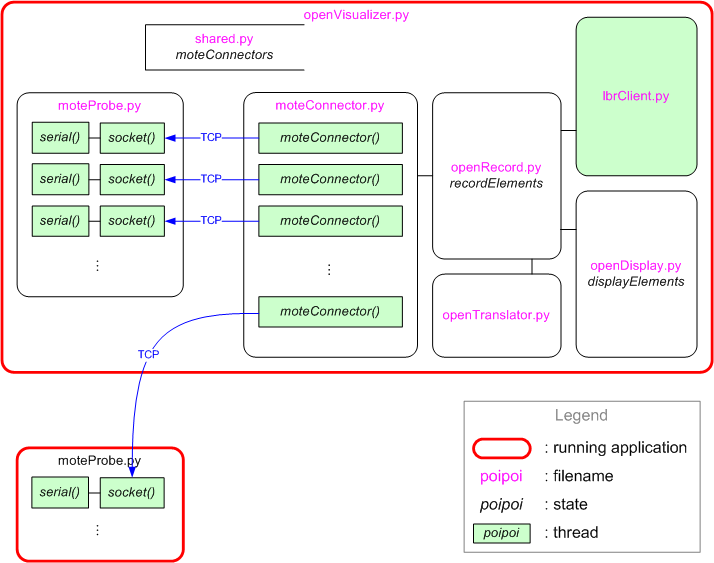
The image to the left shows how the code is organized. Each rectangle represents a file in the OpenVisualizer directory:
- openVisualizerGui.py is the master module. It lists all the connected nodes through a serial port OpenVisualizer.
- Displays errors reported by motes.
- can run with either physical motes, or emulated motes (for details, see OpenSim).
Installation
See the Installation and Dependencies page to download and install OpenVisualizer. The page also describes required libraries and tools.
Running it
The OpenVisualizer consists of core modules, and several types of user interfaces:
- a graphical user interface (GUI)
- a command-line interface (CLI)
- a web interface
| Gliffy | ||
|---|---|---|
|
You can use whichever user interface suits you best. The choice of user interface does not impact the function of the core module.
You start the OpenVisualizer in several ways:
- by invoking the Python script directly (or double-clicking on it)
- by using SCons
graphical user interface (GUI)
starting
You have two options to start it:
- double-click on
openwsn-sw/software/openvisualizer/bin/openVisualizerApp/openVisualizerGui.py enter the following command from
openwsn-sw/software/openvisualizer/:Code Block scons runguiExpand title Full output... Code Block C:\Users\Thomas\Desktop\openwsn-sw\software\openvisualizer>scons rungui scons: Reading SConscript files ... ___ _ _ _ ___ _ _ | . | ___ ___ ._ _ | | | |/ __>| \ | | | || . \/ ._>| ' || | | |\__ \| | `___'| _/\___.|_|_||__/_/ <___/|_\_| |_| openwsn.org scons: done reading SConscript files. scons: Building targets ... uiRunner(["bin\openVisualizerApp\openVisualizerGui"], ["bin\openVisualizerApp\openVisualizerGui.py"]) scons: done building targets.
usage
The "motes" top menu lists all the motes connected to the OpenVisualizer (either physically over a serial port, or as emulated motes):

| Info |
|---|
By default, none of the motes act as the DAG root. The DAGroot (see RFC6550) is the gateway of your OpenWSN network. It is both the root of the routing and synchronization Directed Acyclic Graphs (DAGs). You need exactly one DAGroot in your OpenWSN network, and it can be any OpenWSN node. |
From the "motes" top menu, select the mote to be used as a DAG root and the "toggle" button. The other motes will now synchronize to it and form a DAG.
command line interface (CLI)
starting
You have two options to start it:
- double-click on
openwsn-sw/software/openvisualizer/bin/openVisualizerApp/openVisualizerCli.py enter the following command from
openwsn-sw/software/openvisualizer/:Code Block scons runcliExpand title Full output... Code Block C:\Users\Thomas\Desktop\openwsn-sw\software\openvisualizer>scons runcli scons: Reading SConscript files ... ___ _ _ _ ___ _ _ | . | ___ ___ ._ _ | | | |/ __>| \ | | | || . \/ ._>| ' || | | |\__ \| | `___'| _/\___.|_|_||__/_/ <___/|_\_| |_| openwsn.org scons: done reading SConscript files. scons: Building targets ... uiRunner(["bin\openVisualizerApp\openVisualizerCli"], ["bin\openVisualizerApp\openVisualizerCli.py"]) OpenVisualizer (type "help" for commands) >
usage
The following commands are available:
- TODO
web interface
The web interface is provided by a server application, and of course a browser to view the UI. At present, both server and browser must be on the same host computer.
starting
You have two options to start it:
- double-click on
openwsn-sw/software/openvisualizer/bin/openVisualizerApp/openVisualizerWeb.py enter the following command from
openwsn-sw/software/openvisualizer/:Code Block scons runwebBy default, the server listens on port 8080 on all network interfaces. The command line accepts options for alternate values. Run
scons --helpfor details.
usage
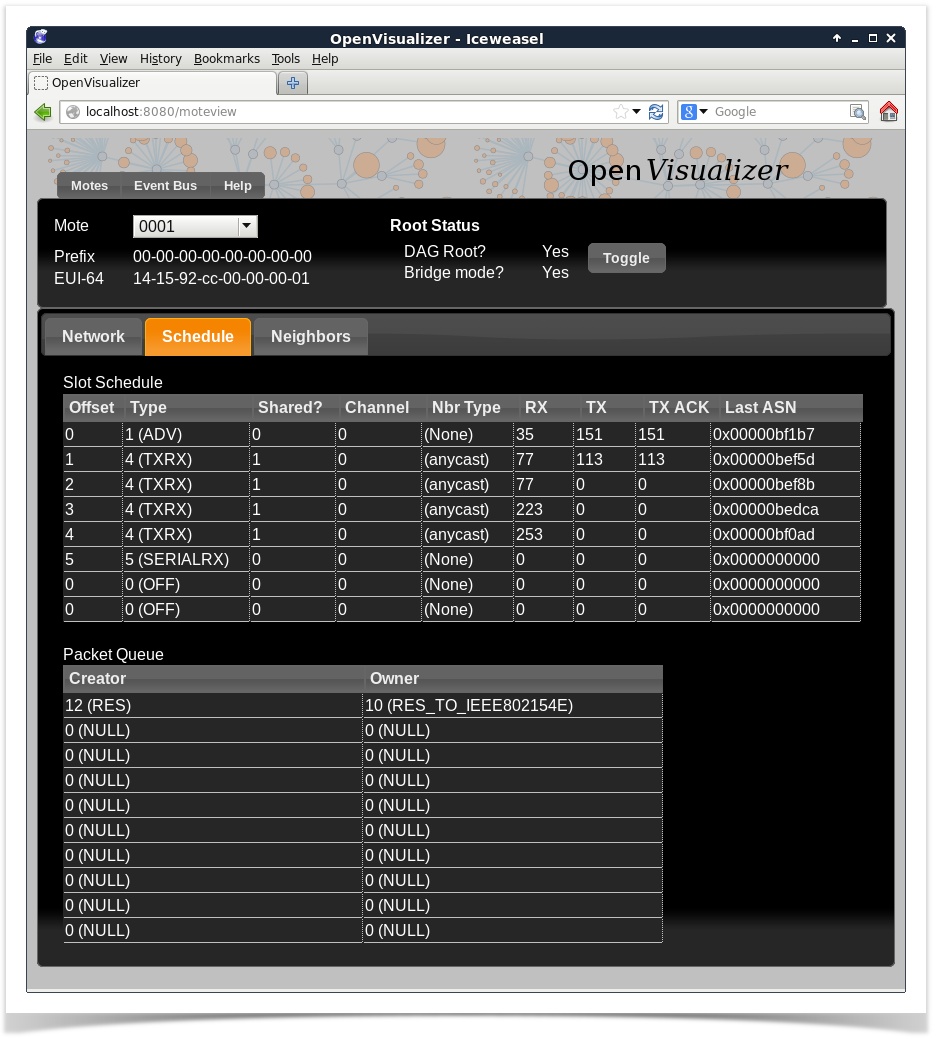
To get started, point your browser to the following URL: http://localhost:8080. The web user interface includes the same information as the GUI described above; however, most of the information is grouped under three tabs. See the screenshot below.
The "motes" dropdown lists all the motes connected to the OpenVisualizer (either physically over a serial port, or as emulated motes):
| Info |
|---|
By default, none of the motes act as the DAG root. The DAGroot (see RFC6550) is the gateway of your OpenWSN network. It is both the root of the routing and synchronization Directed Acyclic Graphs (DAGs). You need exactly one DAGroot in your OpenWSN network, and it can be any OpenWSN node. |
From the "motes" top menu, select the mote to be used as a DAG root and the "toggle" button. The other motes will now synchronize to it and form a DAG.
Code Organization
| Gliffy | ||||
|---|---|---|---|---|
|
Modules
- openVisualizerGui.py is the master module. It can be run against real or simulated motes (see OpenSim). It lists all the connected motes and, for each, spawns a different execution thread.
- moteProbe.py contains the code which is executed by each thread. Whenever data is received from the mote, it is passed along to Parser.py.
- Parser.py dispatch dispatches all the data it receives to respective parser module. In case a frame of Status/Error/ErrorCritical is received from the serial port, ParserInfoErrorCritical.py calls the corresponding
display*function from moteState.py. In case it receives a request to send data from a mote (see OpenSerialToMote), it asks the correct openSerial.py thread to answer accordingly.moteState.py handles - openVisualizerGui.py handles everything which is related to the graphical user interface. It is solely based on
TkInter, the graphical interface which ships by default with Python. A single semaphore is used to arbitrate the access to the graphic elements.openType.py lists the variables which need to be accessed by multiple modules, such as the handlers of the different threads. - StackDefines.py is used by ParserInfoErrorCritical.py to translate error and status code into human-readable text.