...
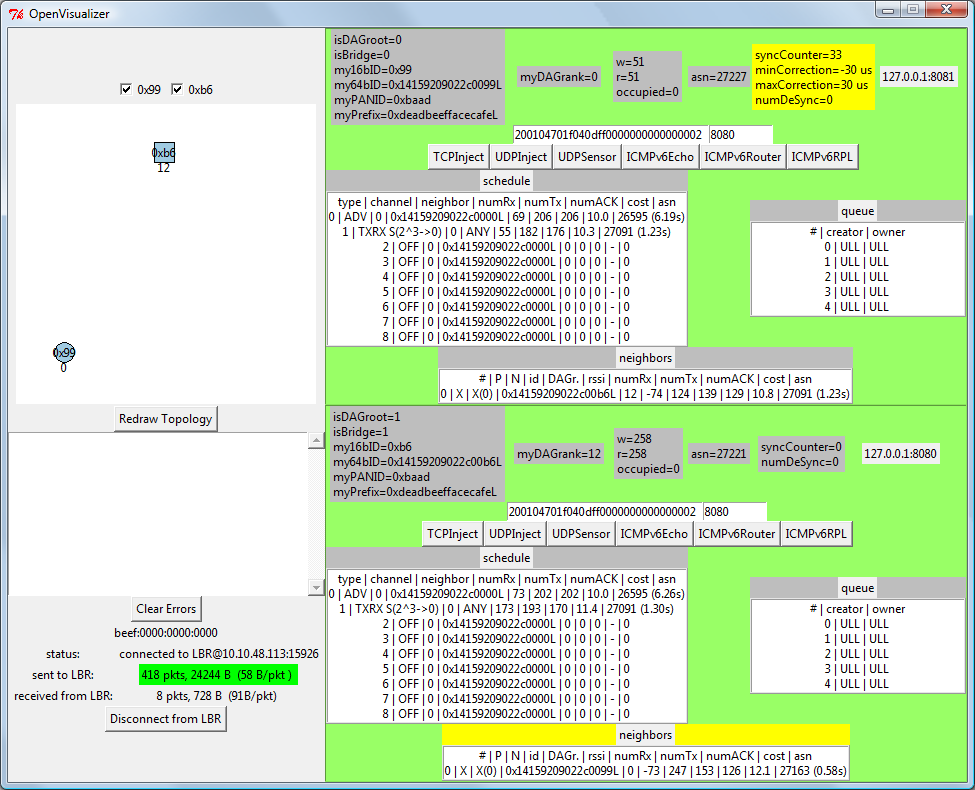
- shows the internal state (neighbor table, scheduling table, queue, etc.) of each node connected to the interface;
- displays the multi-hop graph;
- translate error codes into human-readable sentences;
- buttons allows a use to trigger the sending of a packet;
- *New! * nodes can be connected either locally or remotely as an OpenVisualizer probe.
Running it

- install Python from http://www.python.org/;
- install PySerial from http://pyserial.sourceforge.net/;
- download the OpenVisualizer directory. See important note below;
- double click on openVisualizer.py.
...
The OpenVisualizer Window is depicted on the right. By default, the right pannel is closed. The numbers under the graph at the 16-bit short identifiers of the nodes connected via USB to the application. Click on any checkbutton will open the corresponding frame in the right panel. Each of these frames shows the internals of the nodes, including a few button to force it to send an ICMPv6 echo, a UDP or a TCP packet. In each table, the line which was just updated is displayed with a yellow background. The lower-left part of the window contains the errors reported by the nodes.
Code Organization

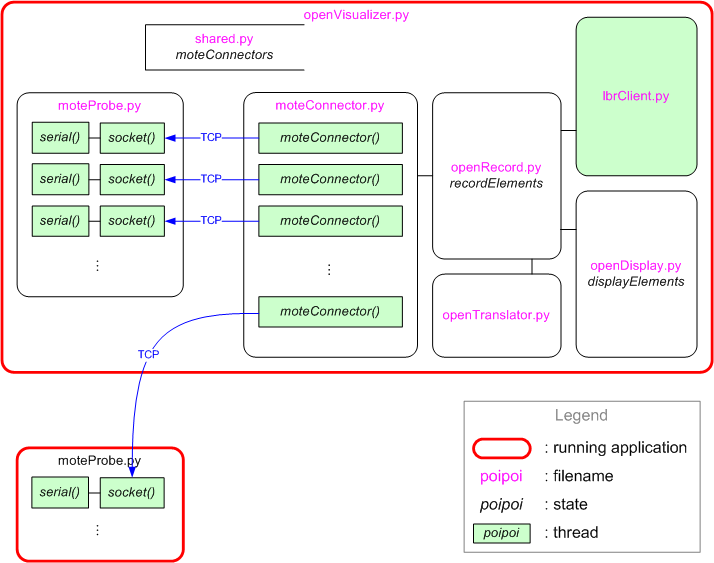
The image to the left shows how the code is organized. Each rectangle represents a file in the OpenVisualizer directory:
...