OpenVisualizer is the OpenWSN tool for visualization, debugging and simulation of the motes. It's a set of python scripts designed to aid in the debugging process, or simply serve as a visualization platform. OpenVisualizer supports the following features:

Important: OpenVisualizer is sensitive to its directory structure. OpenVisualizer displays any potential errors that a mote may throw over serial or IP. It does this efficiently by scanning the openwsn.h file for error codes. The best way to make sure that this setup works, is by simply checking out the entire OpenWSN project from the SVN. Otherwise, please make sure that the following holds:
OpenVisualizer should be placed in: (your openwsn-sw directory)/software/openvisualizer/bin/openVisualizerGui/
openwsn.h should be located in: (your openwsn-fw directory)/firmware/openos/openwsn/
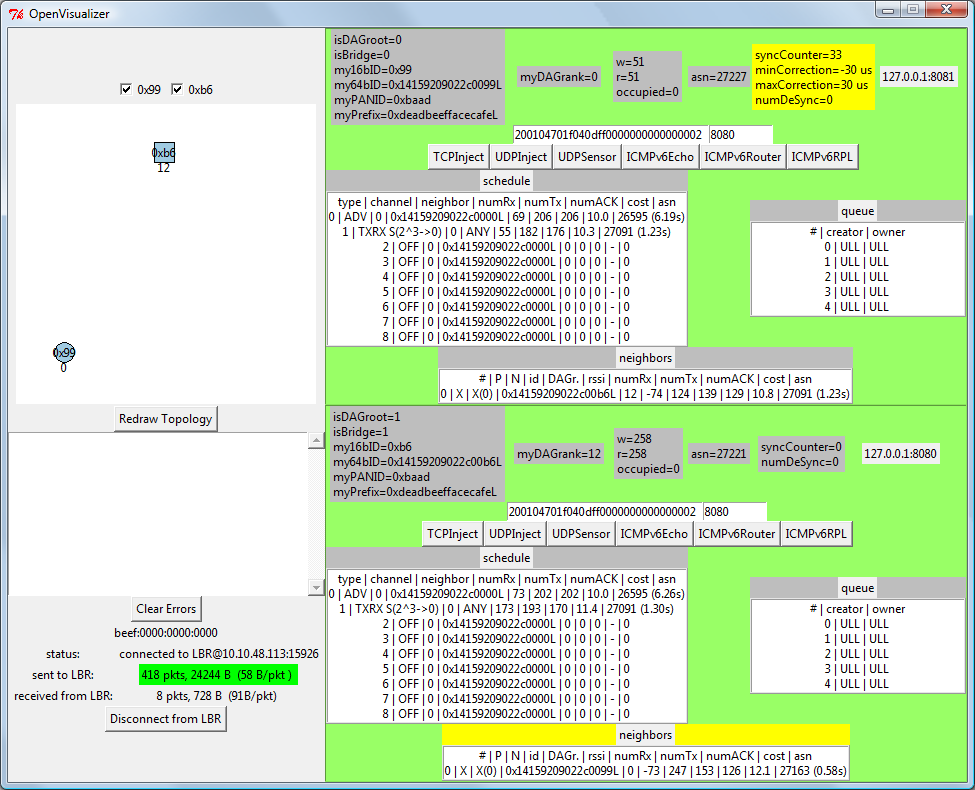
The OpenVisualizer Window is depicted on the right. By default, the right pannel is closed. The numbers under the graph at the 16-bit short identifiers of the nodes connected via USB to the application. Click on any checkbutton will open the corresponding frame in the right panel. Each of these frames shows the internals of the nodes, including a few button to force it to send an ICMPv6 echo, a UDP or a TCP packet. In each table, the line which was just updated is displayed with a yellow background. The lower-left part of the window contains the errors reported by the nodes.

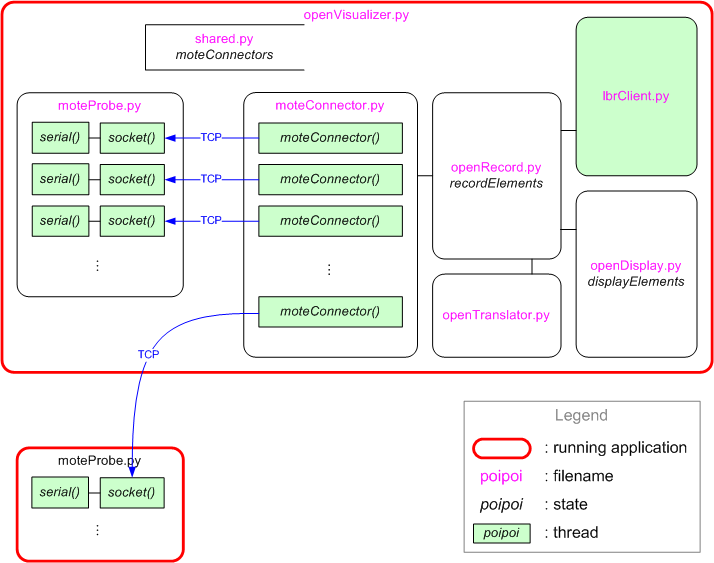
The image to the left shows how the code is organized. Each rectangle represents a file in the OpenVisualizer directory:
display* function from moteState.py. In case it receives a request to send data from a mote (see Serial Format thread in this section), it asks the correct openSerial.py thread to answer accordingly.TkInter, the graphical interface which ships by default with Python. A single semaphore is used to arbitrate the access to the graphic elements.