If you are completely new to OpenWSN, and you are using Linux, read this page first. It will walk you through all the steps to install OpenWSN and explore a number of key features.
...
| Tip | |||||||||||||||||
|---|---|---|---|---|---|---|---|---|---|---|---|---|---|---|---|---|---|
| |||||||||||||||||
Before you can go on, you need to install some Python packages:
Or install them simple with one command.
PySerial is also required and it's available in Debian/Ubuntu. you need to install the PySerial if it's not installed on your machine.
|
...
Open http://127.0.0.1:8080/ to see the web interface of OpenWSN
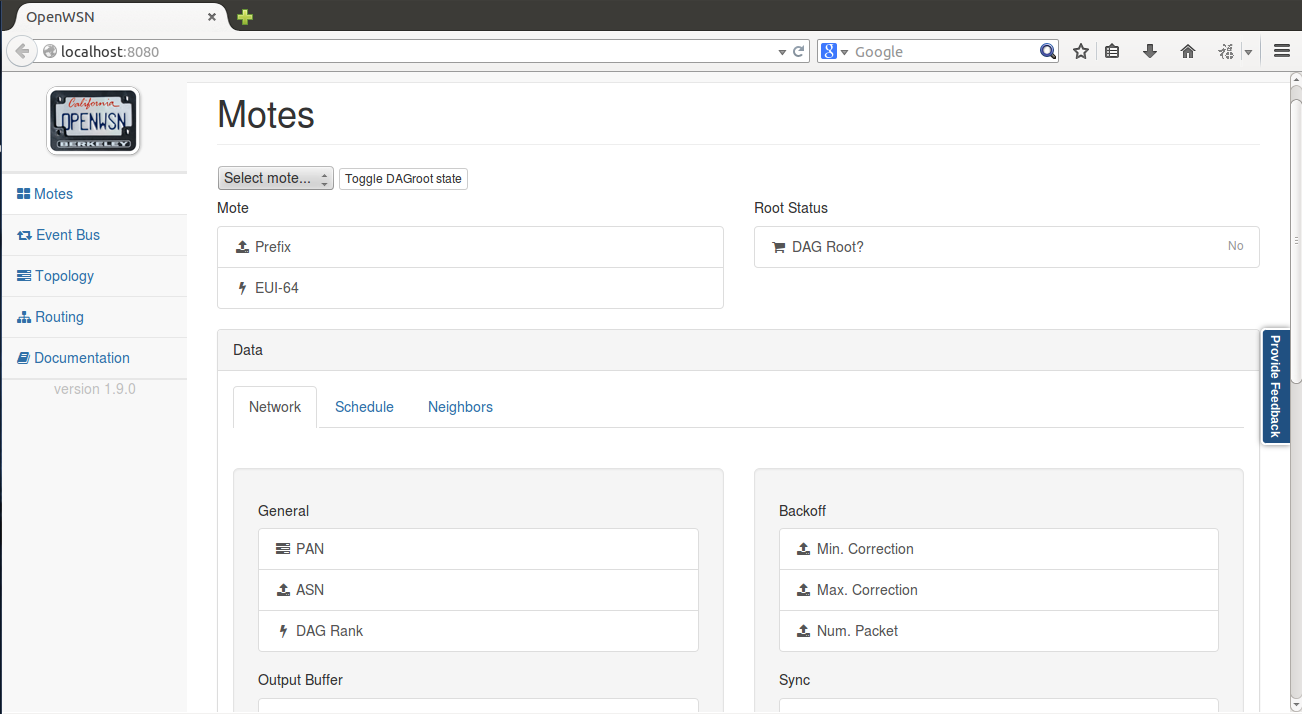

Open the "Topology" tab:
- left click on a mote to move it around
right-click on two motes to connect them with a wireless link
Tip You need to right-click on the red balloon, not the blue rectangle. Confusing, right?
Also, to create a link, you need to right-click on both endpoints.
- left-click on a link to change its PDR (packet delivery ratio)
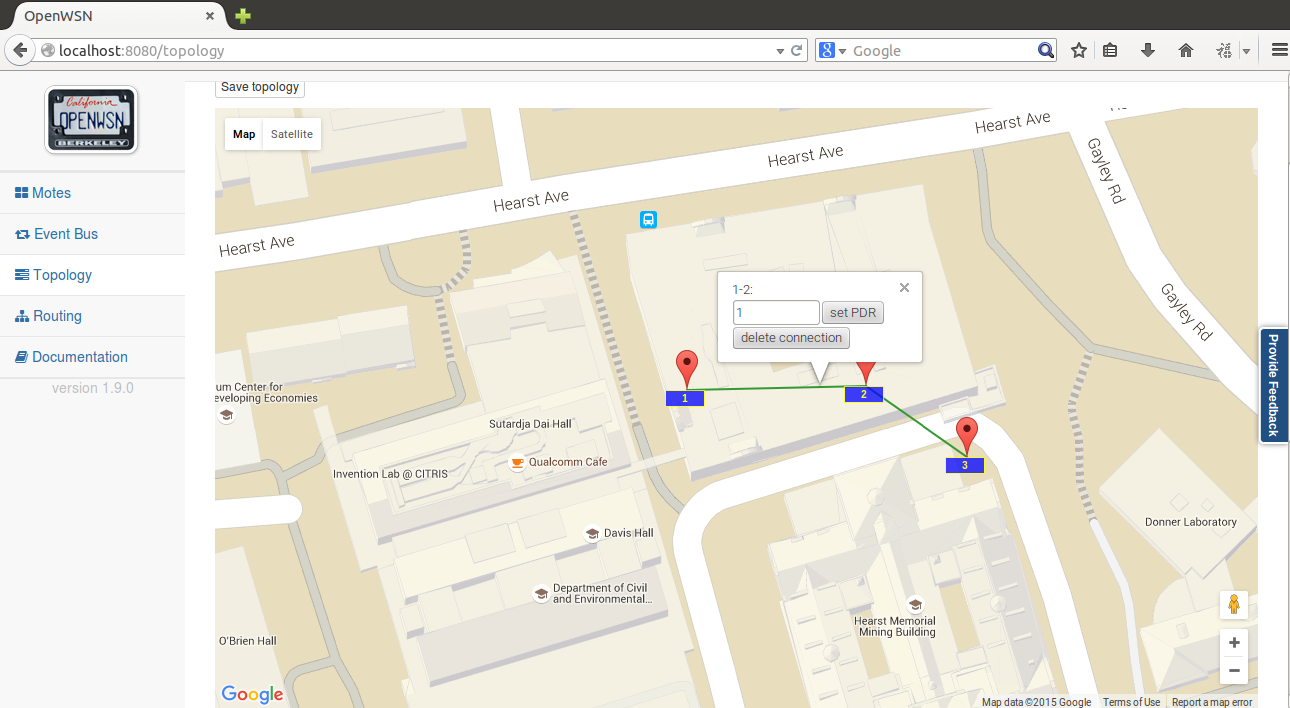
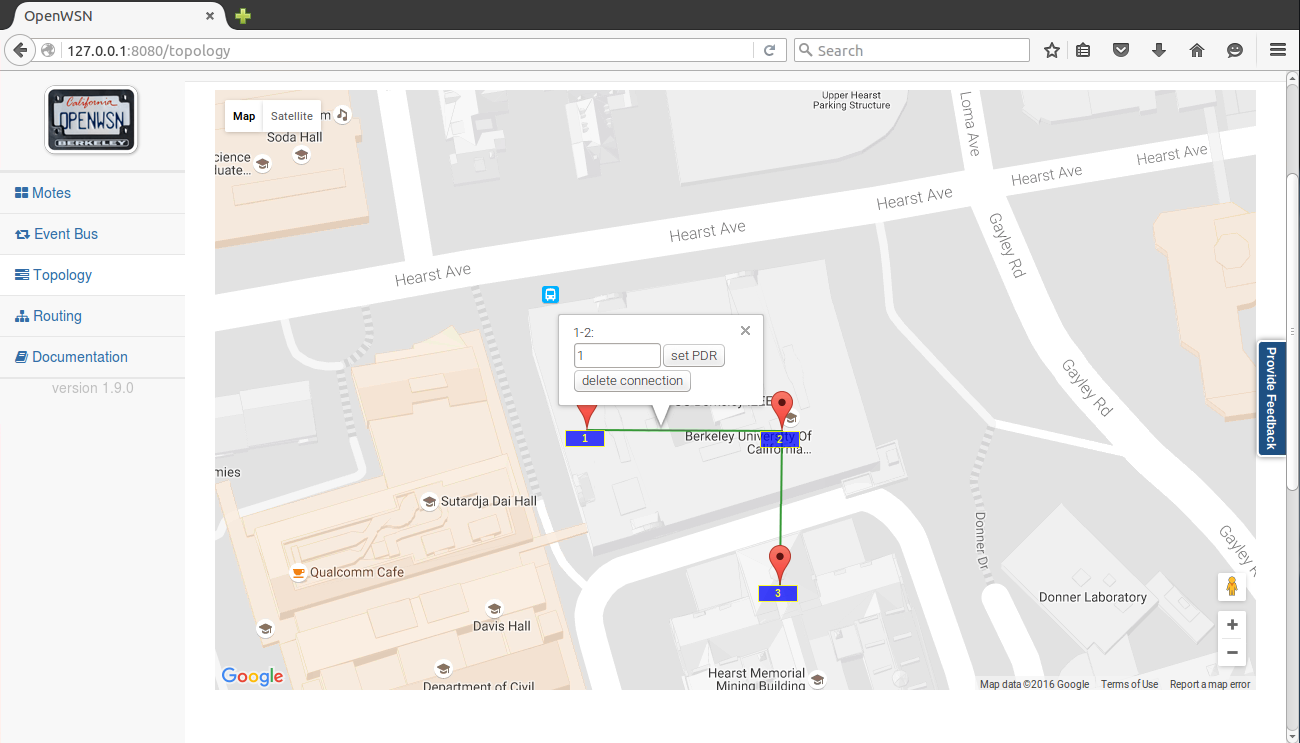
Set up the topology to have a chain 1-2-3, and set each PDR to 1.
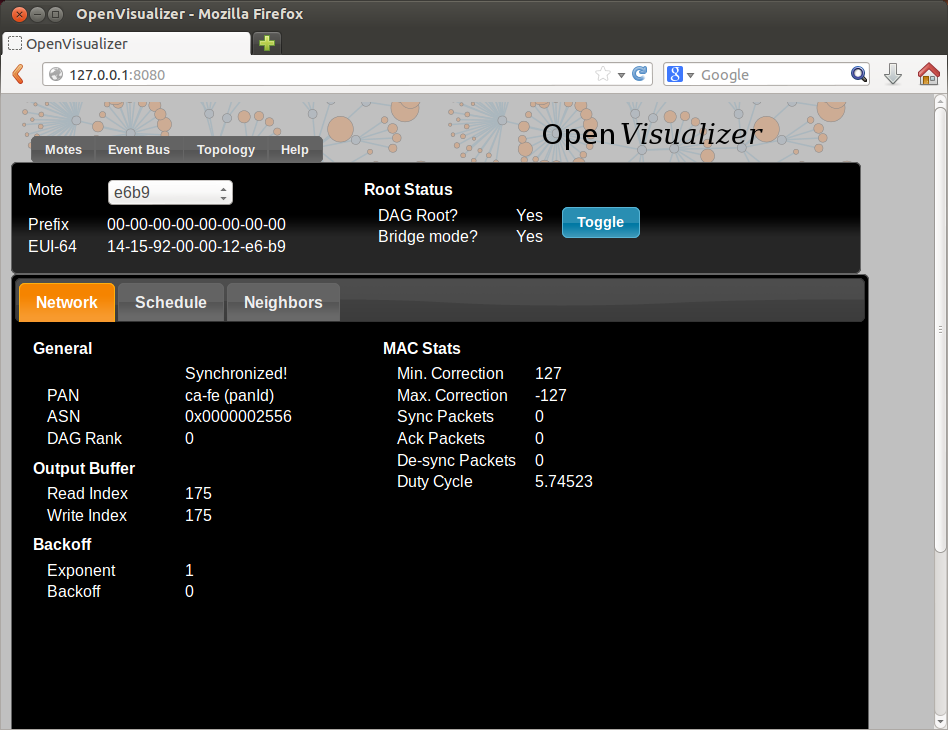
Back in the "Motes" tab, select mote 0001 and click on the "Toggle" button. You just declare mote 1 to be the root of your network (the DAGroot in RPL parlance, the sink in WSN parlance, the gateway, etc). You can select other motes and see that they quickly become "Synchronized!"join the network and obtained the same prefix bbbb::/64.
Congratulations, you have built your first OpenWSN simulated network!
...
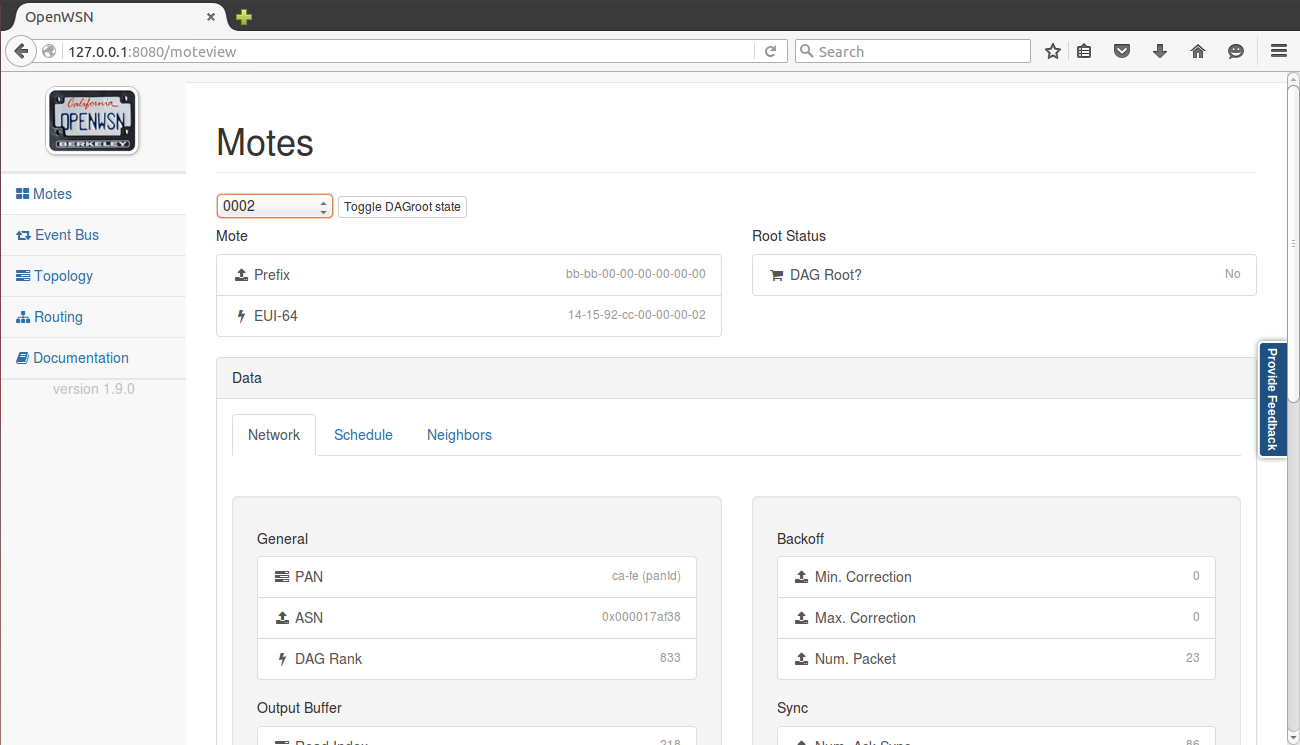
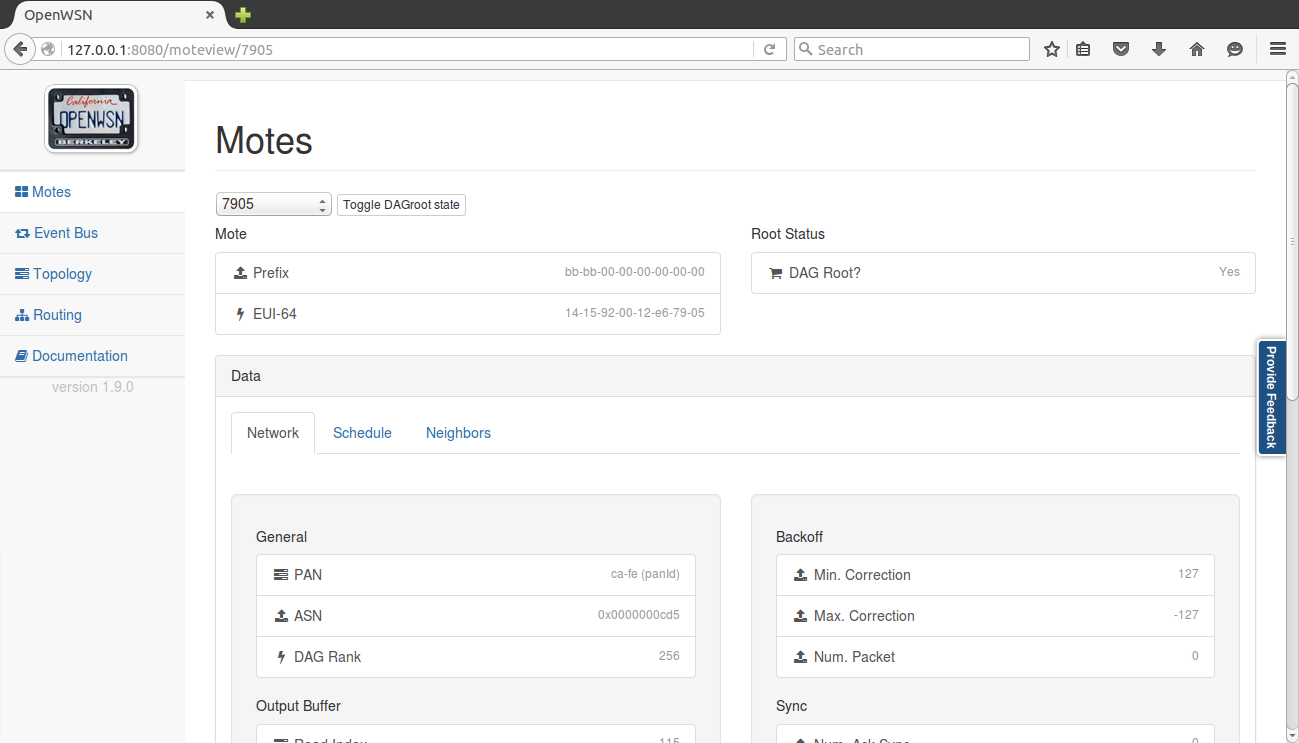
By convention (i.e. this is hard-coded in the software), the IPv6 prefix of the simulated network is bbbb:/64. This means that the IPv6 address of each mote will start with "bbbb::". The remainder of a mote's IPv6 address is it's MAC address (or EUI-64). You can read this in the web interface (under "EUI-64").

 Open a new terminal to ping mote 2:
| Code Block | ||
|---|---|---|
| ||
~/Desktop/openwsn/openwsn-sw/software/openvisualizer$ ping6 -s 10 bbbb::1415:92cc:0:2
PING bbbb::1415:92cc:0:2(bbbb::1415:92cc:0:2) 56 data bytes
64 bytes from bbbb::1415:92cc:0:2: icmp_seq=1 ttl=64 time=51.1 ms
64 bytes from bbbb::1415:92cc:0:2: icmp_seq=2 ttl=64 time=134 ms
64 bytes from bbbb::1415:92cc:0:2: icmp_seq=3 ttl=64 time=137 ms
64 bytes from bbbb::1415:92cc:0:2: icmp_seq=4 ttl=64 time=101 ms
^C
--- bbbb::1415:92cc:0:2 ping statistics ---
4 packets transmitted, 4 received, 0% packet loss, time 3004ms
rtt min/avg/max/mdev = 51.172/106.146/137.486/34.713 ms |
...
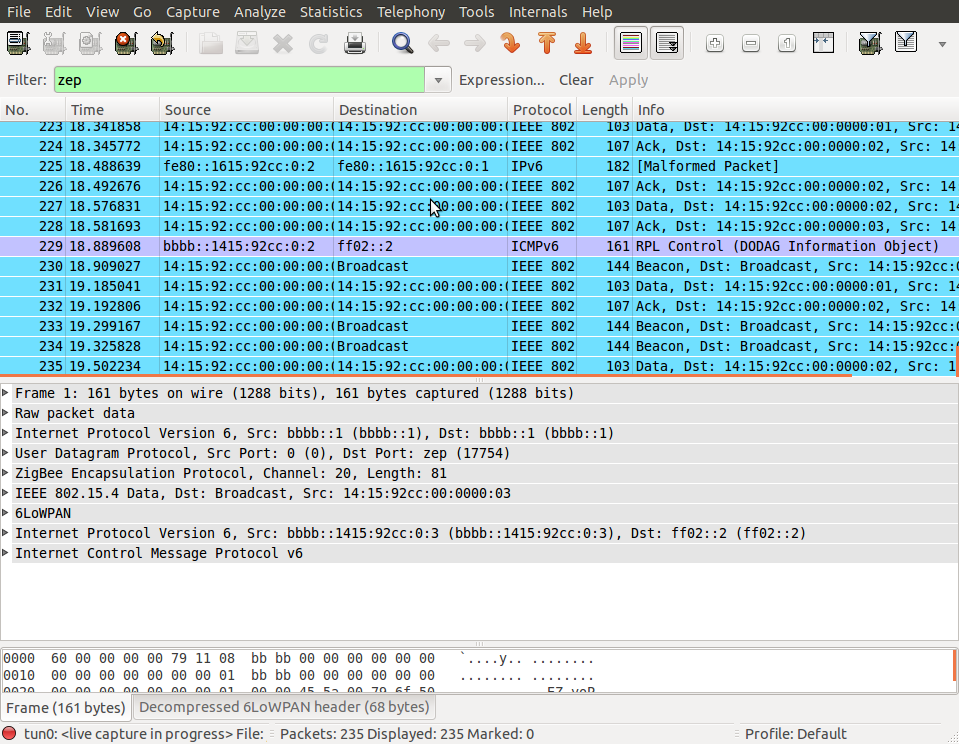
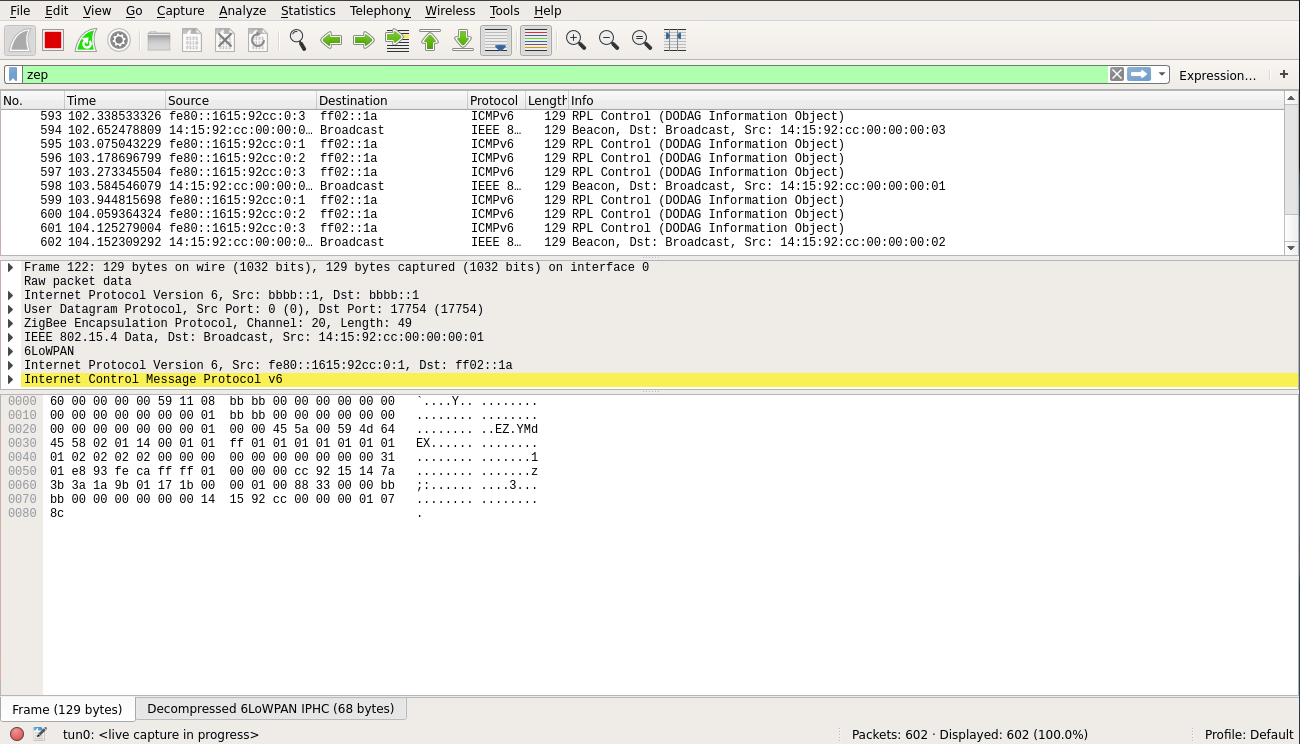
For now, you don't see any packets, that's normal:
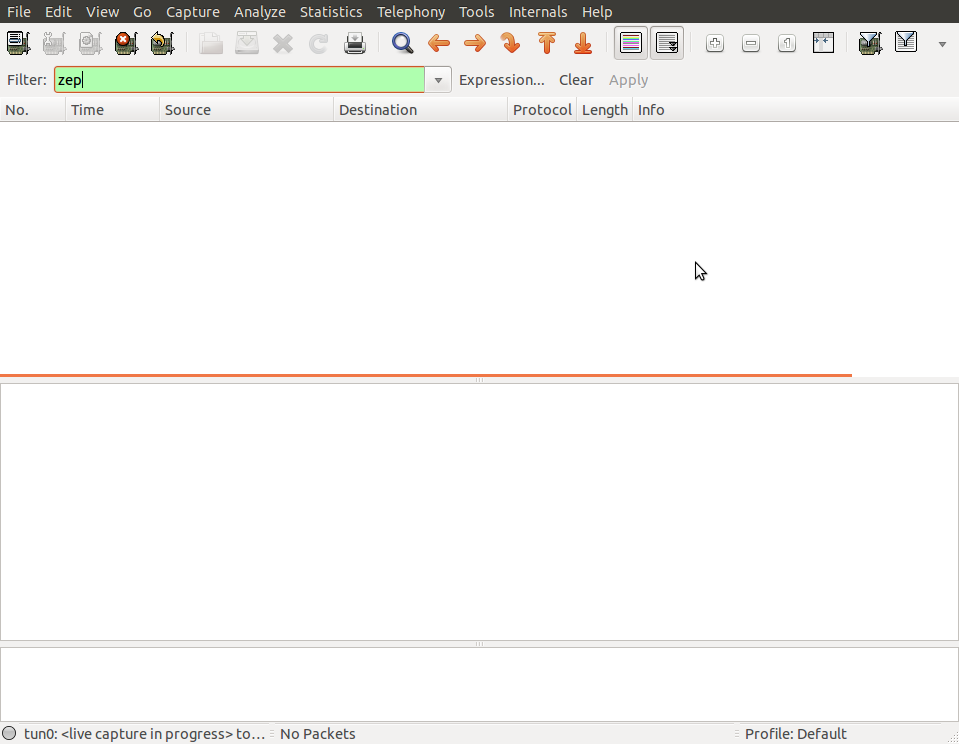
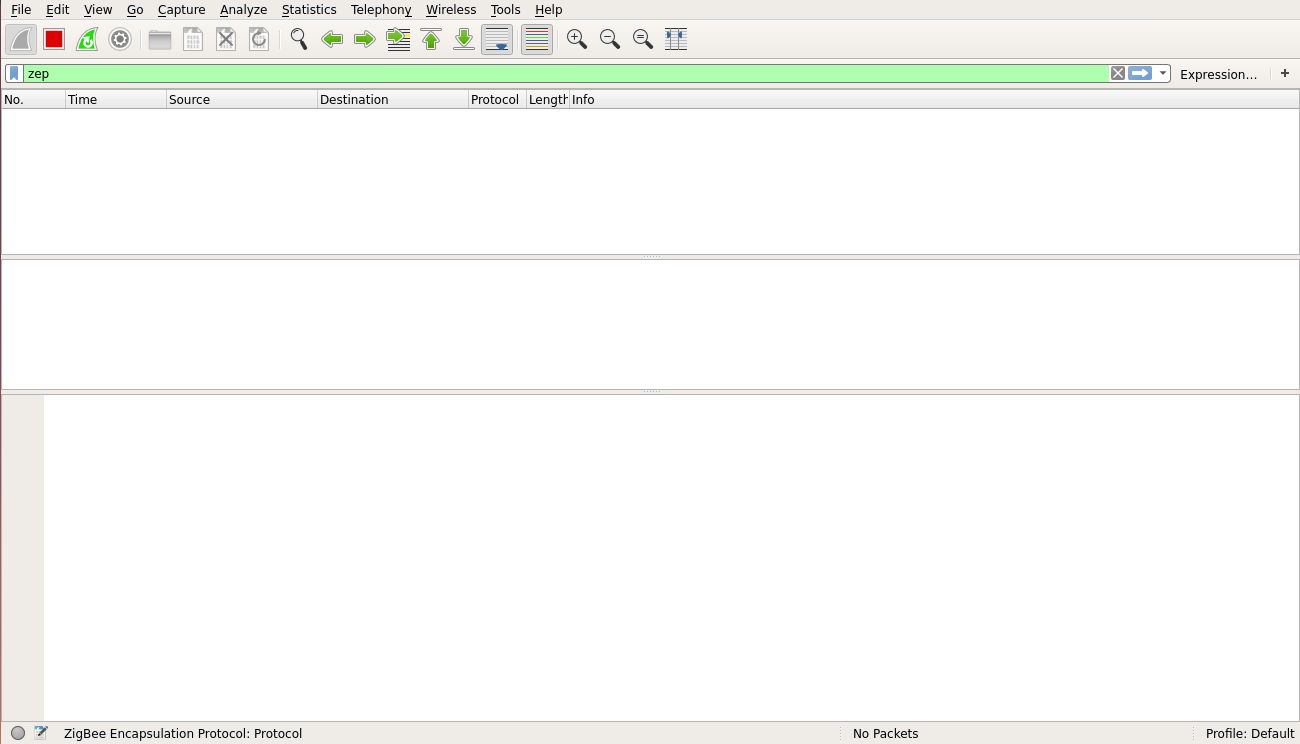
In the OpenVisualizer's "Event bus" tab, check the "Wireshark debug" box.
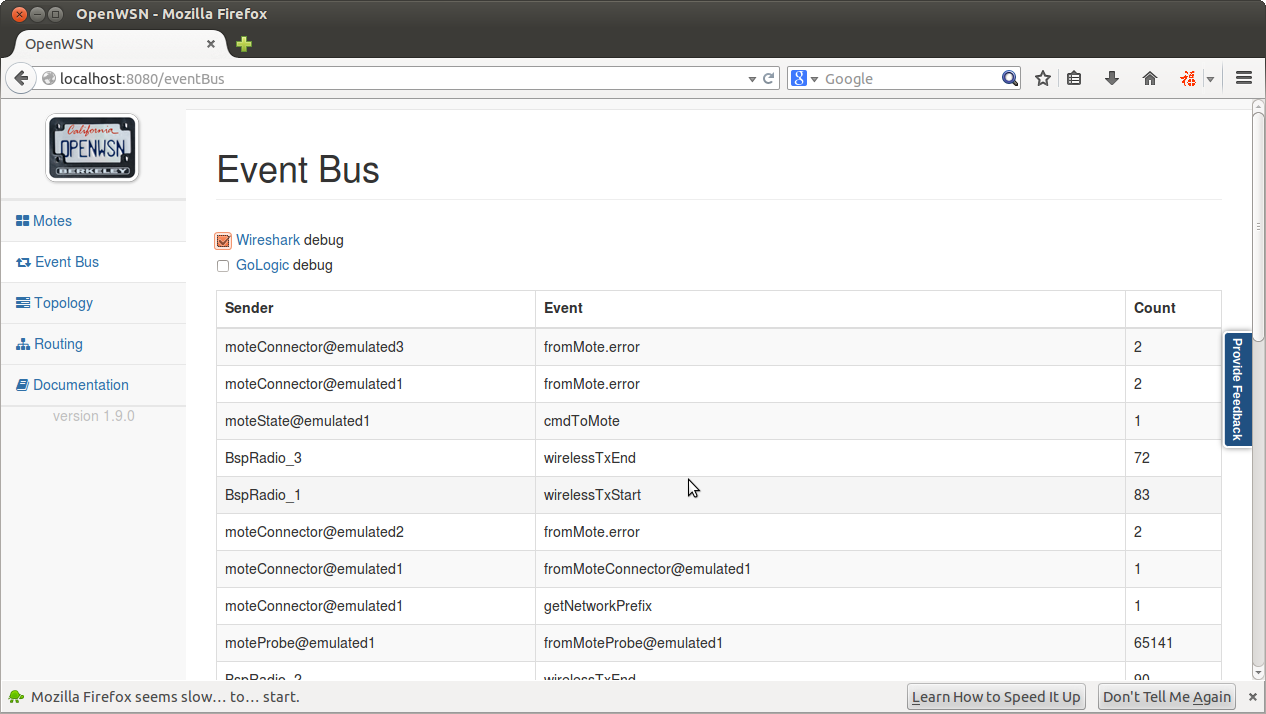
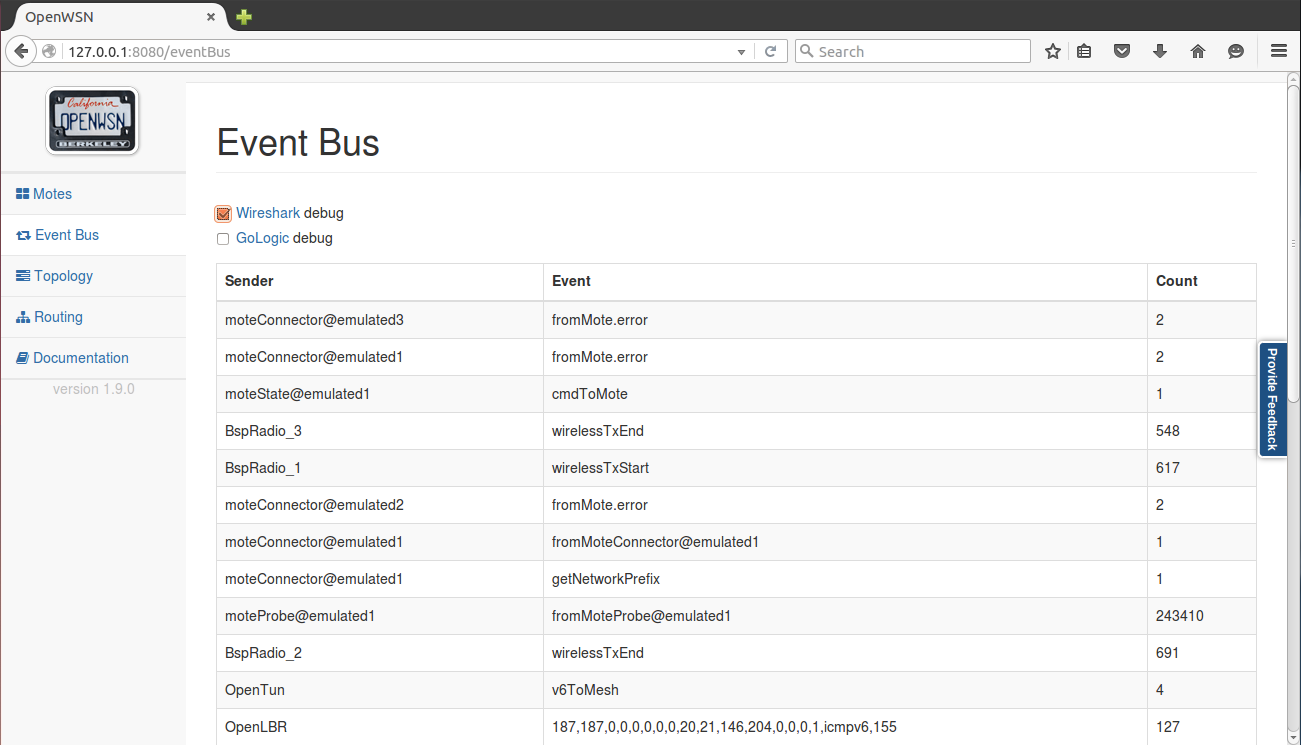
You now see all the packets exchanged over the simulated radio environment, exciting!
Closing the OpenVisualizer
...
Open http://127.0.0.1:8080/ to see the web interface:
Your TelosB motes turn on their blue LED once synchronized.
...